Inclinations
what is it
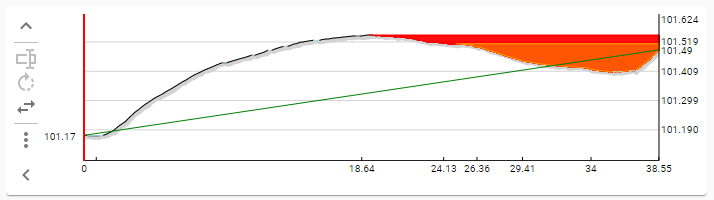
The inclination report gives you an overview of the vertical movement that the tractor did. In other words, it shows you where it went uphill or downhill and by how much. This information can tell you where possible water puddles can form or where the water flow is slowed down/ speeds up.
how are they calculated
An inclination report can only be build if the tractor reports the distance that it has traveled and at which pitch it made that distance. From there, it's just some basic trigonometry to build the image.
reverse recordings
Some devices might produce too many chocks from starting and stopping constantly while performing the regular video recording which results in false inclination problems. To tackle this issue, cam-i supports the possibility to perform a special recording while traversing backwards, after the video recording has been done. Only tractor data is captured during this reverse recording. This can be used to build a better inclination report cause of the smoother driving of the crawler.

To start a reverse recording, there must first have been a regular recording for the strand and the system must be in live camera-feed instead of video. The inclination report wont be updated live while recording in this mode, it will only be activated once the full recording is done.
features
CAM-I provides a couple of features for you to customize the inclination chart. You can control these features and have an overview of the current values via the toolbar to the left of the graphic.
sample distance

By default, CAM-I shows an inclination report of the finest possible detail that it can produce. Sometimes however, this is not desirable, when only a trend line is needed. For this reason, you can change the sampling distance used while calculating the graph. In other words, if this value is set to 1 meter, than there will be 1 meter between each dot on the graph. By default, this is set to 0.1 meters, but you can increase this all the way to 5 meters.
puddles


Toggle this feature to show or hide the locations on the chart where possible standing water can occur. The color indicates the severity of the situation (% of liquid that can accumulate). Make certain to specify the correct inspection direction for the strand cause this can have a profound effect on where puddles can occur.
inclination corrections


As each point on the chart is calculated based on the previous one, errors will probably accumulate on the inclination chart. This usually results in a line that appears to end up higher than expected. You can correct this error if you have supplied the relative start & end knot depths in the strand details.
the error margin

Each point on the chart can represent multiple sampling points from the tractor cause the selected sampling distance doesn't have to be the same distance at which the tractor samples it's sensors. This means that the point can also be represented as a range. For instance, if the sample data contains 3 points, at heights 1, 2 and 3, the average is 2, but the range is from 1 to 3. This feature allows you to specify how the chart series is drawn: as a single line, a range or both.
grid lines


You can show or hide the horizontal grid lines, which can help to read out the height of a spot. The distance between the lines and the number of lines shown is auto calculated, based on the height of the chart.
x-axis labels
The x-axis currently always show labels. You can however choose what type of info is displayed
 | Show the location of each observation. Use the tractor distance as a label |
 | Shows the labels at a fixed distance of each other. The total nr of labels displayed, depends on the amount of room that is available (auto calculated). The value for the label is the distance, as if it were measured on the base line, as explained in relative start & end knot depths. this can be useful to calculate the location of a problem |
start & end height

You can show/hide the labels to display the exact height at which the start and end points should be, as specified in the strand's details section. The label for the start will be at the left side of the chart, the end point at the right side.
direction

If the strand both has a regular and a reverse recording, than this feature allows you to select which recording you would like to view. If there is no reverse recording, this icon will be disabled.
export

An inclination report can be exported as an svg image. This is useful if you want to compare multiple charts and would like to put them all next to each other. Svg images can be displayed in any modern web browser.